
The relationship between market valuations and subsequent performance has long fascinated investors, economists, and market analysts. Recent data from FactSet provides compelling insights into the S&P 500’s price-earnings ratio evolution over more than two decades, alongside dramatic performance shifts during critical market periods. This analysis examines both the long-term valuation trends and the acute market stress observed during the April selloff period.
Understanding market valuation metrics, particularly the price-earnings (P/E) ratio, serves as a fundamental tool for assessing whether stocks are fairly valued, overvalued, or undervalued relative to historical norms. The P/E ratio, calculated by dividing a company’s stock price by its earnings per share, provides investors with a standardized method to compare valuations across different time periods and market conditions.
The S&P 500’s P/E ratio journey from 2001 to 2025 tells a story of market evolution, showing how valuations have responded to changing economic conditions, corporate earnings growth, interest rate environments, and investor risk appetite. The dramatic swings visible in the data reflect not just mathematical relationships between stock prices and earnings, but broader narratives about economic growth expectations, inflation concerns, and geopolitical uncertainties.
During the early 2000s, the market was still digesting the aftermath of the technology bubble burst, leading to compressed valuations as investors became more cautious about growth projections and earnings sustainability. The subsequent recovery period saw gradual valuation expansion, punctuated by the severe compression during the 2008-2009 financial crisis when both stock prices and earnings came under tremendous pressure.
Historical P/E Ratio Trends and Market Cycles
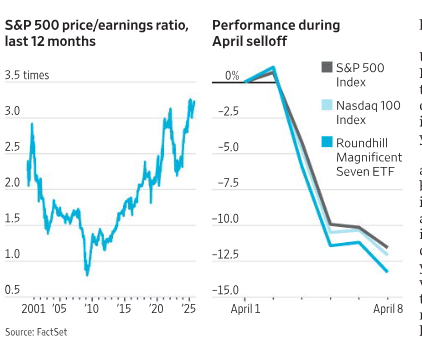
The 25-year chart of S&P 500 price-earnings ratios reveals distinct phases of market valuation cycles, each corresponding to different economic and financial market environments. Starting from 2001, the data shows initial P/E levels around 2.5 times, which reflected the market’s adjustment following the dot-com bubble collapse. This period of compressed valuations represented a market reset, where investors demanded lower prices relative to earnings as a risk premium for uncertainty.
The period from 2002 to 2007 demonstrates a gradual recovery in market confidence, with P/E ratios climbing steadily from approximately 1.0 to nearly 2.0 times. This expansion phase coincided with strong corporate earnings growth, low interest rates, and general economic stability. The steady upward trajectory during these years reflected improving economic fundamentals and growing investor optimism about future corporate profitability.
The 2008-2009 financial crisis created one of the most dramatic valuation compressions visible in the dataset, with P/E ratios plummeting to historic lows near 0.8 times. This severe contraction resulted from both declining stock prices and, more significantly, deteriorating corporate earnings as the global economy entered recession. The dual pressure on both numerator and denominator of the P/E calculation created an environment where traditional valuation metrics became temporarily distorted.
The recovery period from 2009 to 2020 shows a remarkable and sustained expansion in valuations, with P/E ratios climbing from their crisis lows to levels exceeding 3.0 times. This extended period of valuation expansion occurred alongside unprecedented monetary policy accommodation, including near-zero interest rates and quantitative easing programs. Low interest rates made stocks more attractive relative to bonds, while abundant liquidity supported higher asset prices across multiple categories.
The most recent period, from 2020 to 2025, exhibits extreme volatility in valuations, with P/E ratios reaching peaks above 3.5 times before experiencing sharp corrections. This period encompasses the COVID-19 pandemic impact, massive fiscal and monetary stimulus, inflation concerns, and subsequent policy tightening. The dramatic swings during this period reflect the market’s struggle to price assets appropriately amid rapidly changing economic conditions and policy responses.
April Selloff Analysis and Performance Comparison
The second chart provides crucial insight into market behavior during times of stress, specifically focusing on performance during an April selloff period. The comparison between the S&P 500 Index, Russell 100 Index, and Roundhill Magnificent Seven ETF reveals important distinctions in how different market segments responded to selling pressure.
During the initial phase of the April selloff, all three indices began at similar performance levels, indicating that the market stress affected broad market segments relatively equally at the onset. However, as the selloff intensified, significant divergences emerged between the different indices, highlighting varying degrees of investor sentiment and risk appetite across market capitalizations and sector concentrations.
The S&P 500 Index, representing the broad large-cap market, experienced a decline of approximately -11% during the most severe phase of the selloff. This performance reflects the weighted impact of the index’s 500 constituent companies, with larger companies having proportionally greater influence on overall index performance. The S&P 500’s decline demonstrates how broad-based selling pressure affected the core of the American equity market.
The Russell 100 Index, which focuses on the largest 100 companies in the Russell 3000, showed remarkably similar performance to the S&P 500, declining to approximately -11% at the trough. This similarity suggests that the largest companies in the market experienced selling pressure consistent with the broader large-cap universe, indicating that the selloff was not primarily driven by market capitalization preferences but rather by broader sentiment shifts.
Most notably, the Roundhill Magnificent Seven ETF experienced the most severe decline, reaching approximately -13% at its lowest point. This enhanced volatility reflects the concentration risk inherent in technology-focused investments during periods of market stress. The “Magnificent Seven” stocks, representing the largest technology companies that have driven much of the market’s recent performance, often exhibit amplified movements during both rallies and selloffs due to their growth-oriented profiles and higher valuations.
The recovery patterns following the selloff trough also reveal important insights. While all three indices began recovering, the pace and magnitude of recovery varied, with the Magnificent Seven ETF showing signs of potentially stronger rebound momentum, consistent with the higher volatility characteristics of growth-oriented technology stocks.
Investment Implications and Market Outlook
The convergence of long-term valuation trends and short-term performance patterns provides several key insights for investors navigating current market conditions. The historical P/E ratio data suggests that current valuations, while elevated relative to long-term averages, exist within a context of prolonged monetary accommodation and structural changes in the global economy.
From a valuation perspective, the recent peaks in P/E ratios above 3.5 times place the market in territory that historically has been associated with increased volatility and potential for correction. However, the sustained period of elevated valuations from 2020-2025 indicates that traditional valuation metrics may require recalibration for an environment characterized by persistently low interest rates and evolving market structure.
The April selloff analysis reveals that while broad market indices experienced significant but manageable declines, concentration in high-growth technology stocks amplified volatility. This pattern suggests that portfolio diversification across market capitalizations and sectors remains crucial for managing risk, particularly as markets continue to grapple with changing economic conditions.
For investors considering current market conditions, several factors warrant attention. First, the elevated valuation environment suggests that future returns may be more modest than historical averages, requiring realistic expectation setting and potentially longer investment horizons. Second, the demonstrated volatility patterns indicate that tactical allocation decisions may become increasingly important for portfolio management.
The performance divergence between broad market indices and concentrated growth strategies highlights the ongoing relevance of diversification principles. While growth-oriented investments may offer higher return potential, the amplified volatility during stress periods suggests that risk management through diversification across styles, sectors, and market capitalizations remains prudent.
Looking forward, investors should monitor key factors that could influence both valuations and market performance. These include Federal Reserve policy decisions, inflation trends, corporate earnings growth sustainability, and geopolitical developments. The historical data suggests that while markets can sustain elevated valuations for extended periods, eventual corrections are inevitable and often swift.
The combination of valuation awareness and performance pattern recognition provides a framework for making informed investment decisions. Rather than attempting to time markets perfectly, investors may benefit from maintaining disciplined approaches that acknowledge both the potential for continued growth and the reality of periodic corrections, as demonstrated by both the long-term valuation trends and the acute selling pressure observed during the April period.